
Rate of Violent Crime by Census Tract
City of Rochester, New York (2014 - 2016)
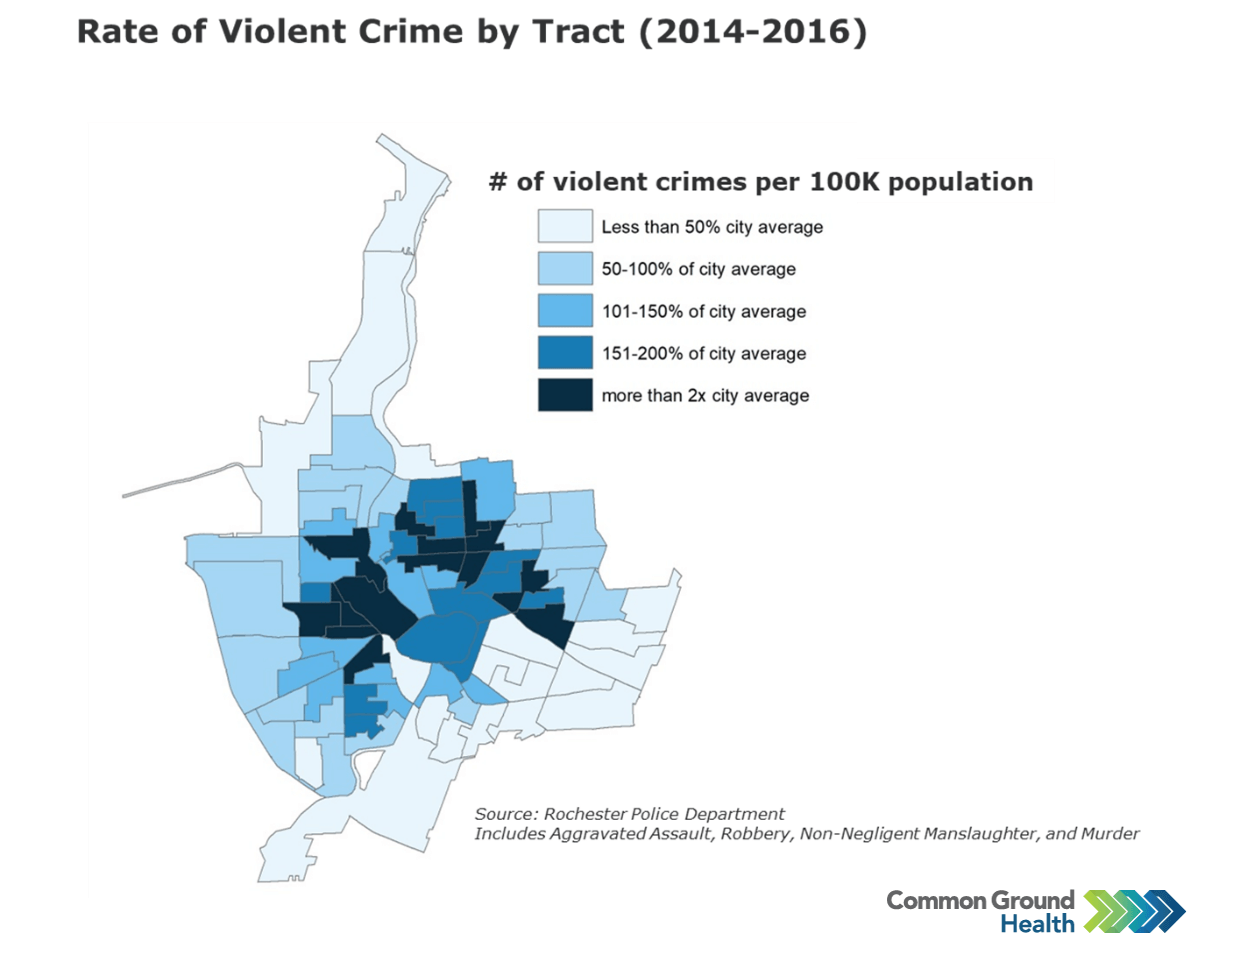
Based on data from the Rochester Police Department, the map below shows large disparities in the prevalence of violent crime at a census tract level. The annual rate of violent crime in the Focus Area* tracts (923 per 100K population) is nearly triple the rate in the other parts of the city (325).
* The Focus Area consists of eight high-poverty ZIP codes in the city of Rochester with particularly high concentration of African-Americans and Latinos. See a map of the Focus Area here.
Images are available for download at no cost and free of any copyright restrictions. We ask that you keep the Common Ground logo on the images to identify the source. To help us improve, we’d love to hear how you are using these resources. Email us at communications@commongroundhealth.org.