
These indicators track trends in key areas for the nine county Finger Lakes region. Common Ground Health will report each measure through 2025.
Trends Over Time
To see progress on each measure over time, click on the shaded circle on each line. Color coding indicates whether the region is getting better, staying the same or getting worse.

Better

Flat

Worse
Health Outcomes
- Premature death
- 3,913

Years of potential life lost before age 65 per 100,000 population (age and sex adjusted), 2016
Race
| White Non-Latino | 3,732 |
| Black Non-Latino | 5,772 |
| Hispanic | 3,532 |
| Other | 3,907 |
Socio Economic Status
| Lowest | 5,470 |
| Second Lowest | 4,074 |
| Middle | 3,515 |
| Second Highest | 3,318 |
| Highest | 2,923 |
Geography
| Chemung | 4,042 |
| Livingston | 3,571 |
| Monroe | 3,836 |
| Ontario | 3,569 |
| Schuyler | 3,742 |
| Seneca | 5,565 |
| Steuben | 4,307 |
| Wayne | 4,386 |
| Yates | 3,966 |
Source: New York State Vital Statistics
- Premature Births
- 9.7%
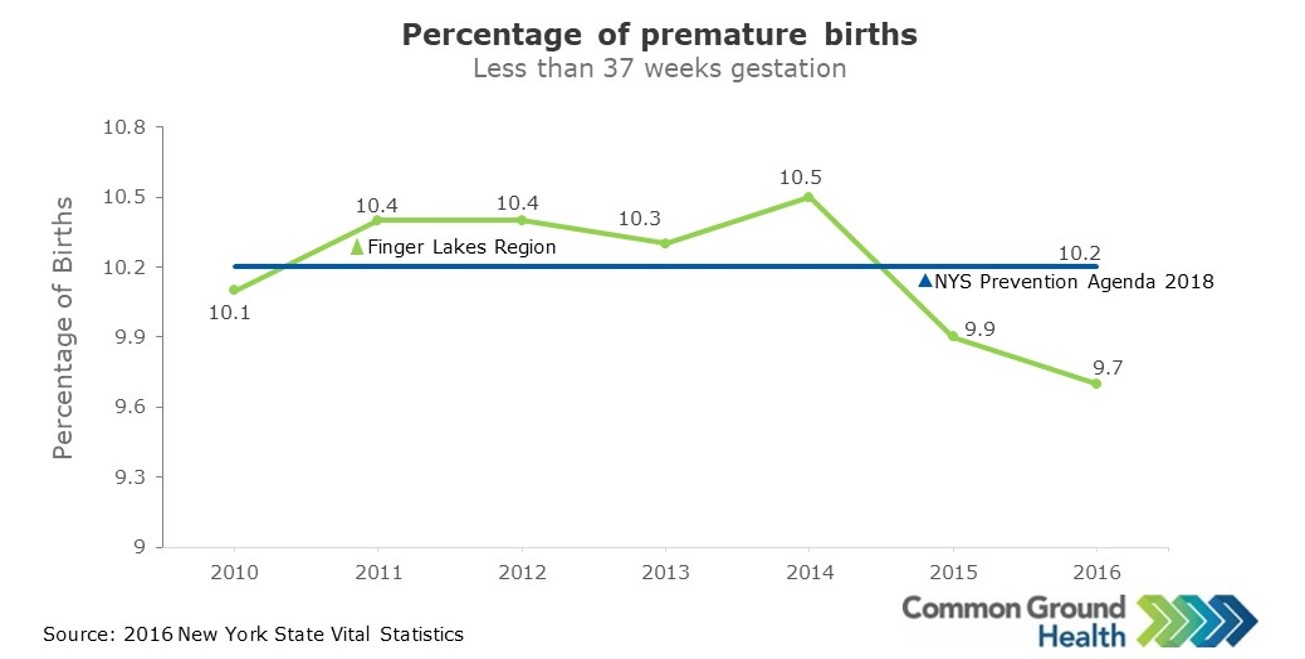
Percentage of premature births (less than 37 weeks), 2016
Geography
| Chemung | 9.8% |
| Livingston | 9.4% |
| Monroe | 10.0% |
| Ontario | 8.1% |
| Schuyler | 11.0% |
| Seneca | 8.6% |
| Steuben | 9.9% |
| Wayne | 9.5% |
| Yates | 5.5% |
Source: New York State Vital Statistics
- Good health self-report
- 87%

Percentage of adults who report excellent, very good or good general health status, 2016
Geography
| Chemung | 86.0% |
| Livingston | 87.0% |
| Monroe | 88.0% |
| Ontario | 90.0% |
| Schuyler | 86.0% |
| Seneca | 83.0% |
| Steuben | 85.0% |
| Wayne | 87.0% |
| Yates | 93.0% |
Source: NYS Expanded Behavioral Risk Factor Surveillance System
Community Measures
- Childhood immunization
- 73.3%

Percentage of children 24-35-month old children with the recommended immunization series, 2018
Geography
| Chemung | 62.7% |
| Livingston | 87.3% |
| Monroe | 76.8% |
| Ontario | 72.2% |
| Schuyler | 69.8% |
| Seneca | 50.3% |
| Steuben | 62.4% |
| Wayne | 75.1% |
| Yates | 52.8% |
Source: NYS Immunization Information System
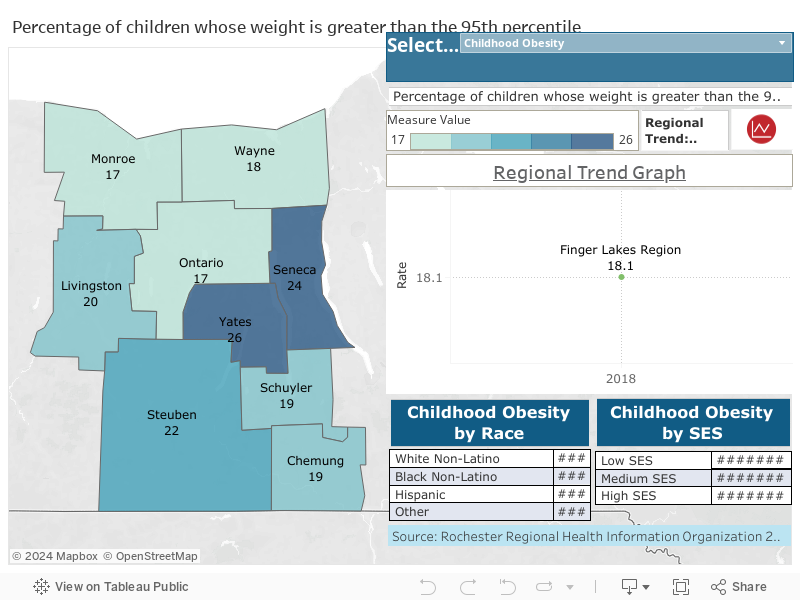
- Childhood obesity
- 18.1%
Percentage of children whose weight is greater than the 95th percentile, 2018
Geography
| Chemung | 18.9% |
| Livingston | 19.5% |
| Monroe | 16.8% |
| Ontario | 17.1% |
| Schuyler | 18.7% |
| Seneca | 24.4% |
| Steuben | 21.8% |
| Wayne | 18.1% |
| Yates | 25.7% |
Source: Rochester Regional Health Information Organization
- Adult obesity
- 45.6%
Percentage of adults who report a BMI of 30.0 or greater, 2018
Geography
| Chemung | 38.6% |
| Livingston | 46.1% |
| Monroe | 43.9% |
| Ontario | 45.6% |
| Schuyler | 45.8% |
| Seneca | 49.5% |
| Steuben | 49.1% |
| Wayne | 50.6% |
| Yates | 47.3% |
Source: Rochester Regional Health Information Organization
- Adult smoking
- 25.1%
Percentage of adults who are current smokers, 2018
Geography
| Chemung | 25.0% |
| Livingston | 27.5% |
| Monroe | 25.2% |
| Ontario | 20.6% |
| Schuyler | 24.5% |
| Seneca | 26.8% |
| Steuben | 26.6% |
| Wayne | 28.4% |
| Yates | 20.0% |
Source: Rochester Regional Health Information Organization
- High blood pressure control
- 65.2%
Percentage of adults with high blood pressure who had their condition under control, 2018
Geography
| Chemung | 61% |
| Livingston | 67.3% |
| Monroe | 63.7% |
| Ontario | 68.5% |
| Schuyler | 68.1% |
| Seneca | 58.9% |
| Steuben | 70.9% |
| Wayne | 66.3% |
| Yates | 70.4% |
Source: Rochester Regional Health Information Organization
- Diabetes
- 81.4%
Percentage of adults with diabetes who had their condition under control, 2018
Geography
| Chemung | 80.1% |
| Livingston | 80.7% |
| Monroe | 83.0% |
| Ontario | 82.1% |
| Schuyler | 81.2% |
| Seneca | 81.3% |
| Steuben | 66.9% |
| Wayne | 80.7% |
| Yates | 82.4% |
Source: Rochester Regional Health Information Organization
- High school graduation
- 85.2%
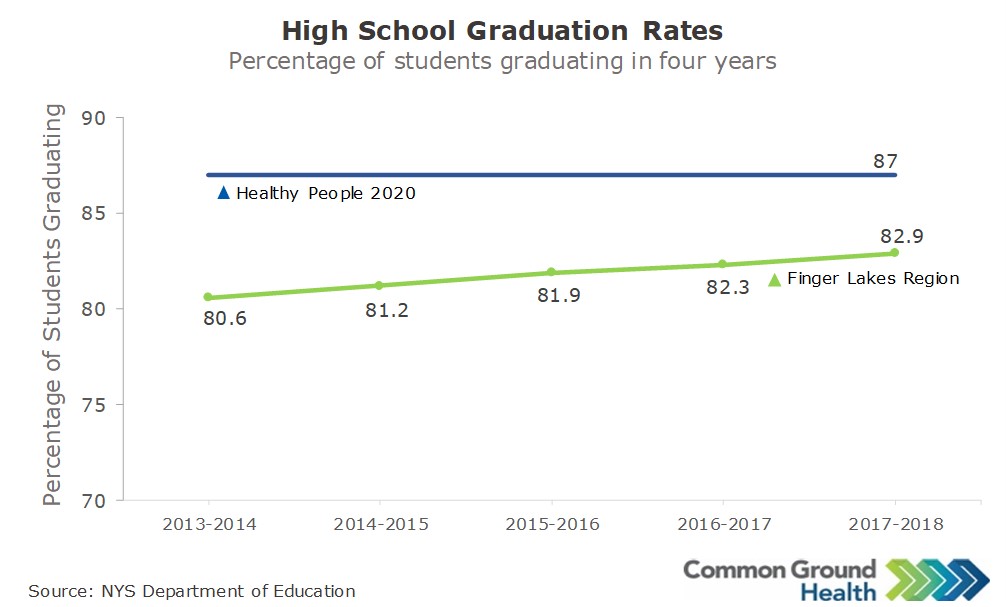
Percentage of students graduating in four years in the Finger Lakes region, 2019
Race
| White Non-Latino | 89.7% |
| Black Non-Latino | 70.9% |
| Hispanic | 75.8% |
| Other | 85.7% |
Socio Economic Status
| Low | 74.6% |
| Middle/High | 93.4% |
Geography
| City of Rochester | 63.0% |
| 9-County Finger Lakes Region | 85.2% |
Source: NYS Department of Education
Clinical Measures
- Preventable hospital stays
- 1,164
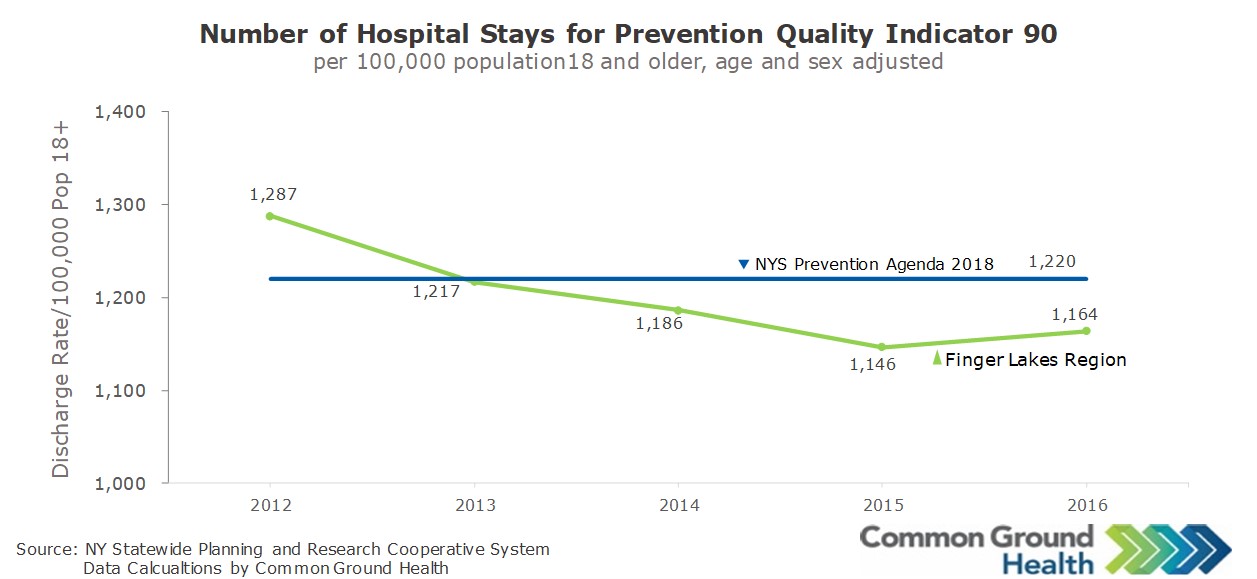
Number of hospital stays for Prevention Quality Indicator 90 (PQI 90) per 100,000 (age and sex adjusted), 2015-2016
Race
| White Non-Latino | 1,002 |
| Black Non-Latino | 2,560 |
| Hispanic | 1,682 |
| Other | 1,623 |
Socio Economic Status
| Lowest | 2,128 |
| Second Lowest | 1,303 |
| Middle | 1,069 |
| Second Highest | 875 |
| Highest | 608 |
Geography
| Chemung | 1,456 |
| Livingston | 1,148 |
| Monroe | 1,107 |
| Ontario | 1,068 |
| Schuyler | 1,293 |
| Seneca | 1,376 |
| Steuben | 1,135 |
| Wayne | 1,417 |
| Yates | 1,131 |
Source: NY Statewide Planning and Research Cooperative System Data Surveillance System
- ED visits with behavioral health diagnosis
- 9.6%

Percentage of all emergency department patients with a behavioral health diagnosis (age and sex adjusted), 2016
Race
| White Non-Latino | 10.2% |
| Black Non-Latino | 7.8% |
| Hispanic | 10.6% |
| Other | 7.6% |
Socio Economic Status
| Lowest | 9.9% |
| Second Lowest | 10.8% |
| Middle | 8.4% |
| Second Highest | 9.0% |
| Highest | 9.2% |
Geography
| Chemung | 8.5% |
| Livingston | 11.9% |
| Monroe | 9.9% |
| Ontario | 9.7% |
| Schuyler | 4.0% |
| Seneca | 16.9% |
| Steuben | 6.3% |
| Wayne | 11.8% |
| Yates | 6.8% |
Source: NY Statewide Planning and Research Cooperative System Data
- ED visits among those 65+
- 337

Number of emergency department visits that involve adults 65 and older per 1,000 (age and sex adjusted), 2016
Race
| White Non-Latino | 318 |
| Black Non-Latino | 517 |
| Hispanic | 496 |
| Other | 564 |
Socio Economic Status
| Lowest | 471 |
| Second Lowest | 388 |
| Middle | 365 |
| Second Highest | 307 |
| Highest | 201 |
Geography
| Chemung | 411 |
| Livingston | 295 |
| Monroe | 306 |
| Ontario | 354 |
| Schuyler | 541 |
| Seneca | 299 |
| Steuben | 444 |
| Wayne | 339 |
| Yates | 445 |
Source: NY Statewide Planning and Research Cooperative System Data
- 30 day readmissions with behavioral health diagnoses
- 13.4%

Percentage of adults who are readmitted to the hospital within 30 days who also have a behavioral health diagnosis (age and sex adjusted), 2014
Race
| White Non-Latino | 13.6% |
| Black Non-Latino | 16.7% |
| Hispanic | 18.4% |
| Other | 9.8% |
Socio Economic Status
| Lowest | 16.0% |
| Second Lowest | 14.3% |
| Middle | 13.3% |
| Second Highest | 11.7% |
| Highest | 10.0% |
Geography
| Chemung | 14.1% |
| Livingston | 12.2% |
| Monroe | 14.7% |
| Ontario | 13.5% |
| Schuyler | 12.3% |
| Seneca | 13.9% |
| Steuben | 13.2% |
| Wayne | 14.1% |
| Yates | 10.4% |
Source: NY Statewide Planning and Research Cooperative System Data Surveillance System
- Opioid ED and Inpatient Visits
- 2.605

Opioid ED and IP Visits, FL Region, 2016
ED and inpatient visits w/ an opioid-related dx as primary or secondary
Overdose
| 2011 | 393 |
| 2012 | 391 |
| 2013 | 492 |
| 2014 | 700 |
| 2015 | 591 |
| 2016 | 952 |
Other Dependency/Abuse
| 525 |
| 665 |
| 783 |
| 881 |
| 997 |
| 1,653 |
Source: NY Statewide Planning and Research Cooperative System Data Surveillance System
- Medication Assisted Treatment for Opioid Addiction
- 4,899
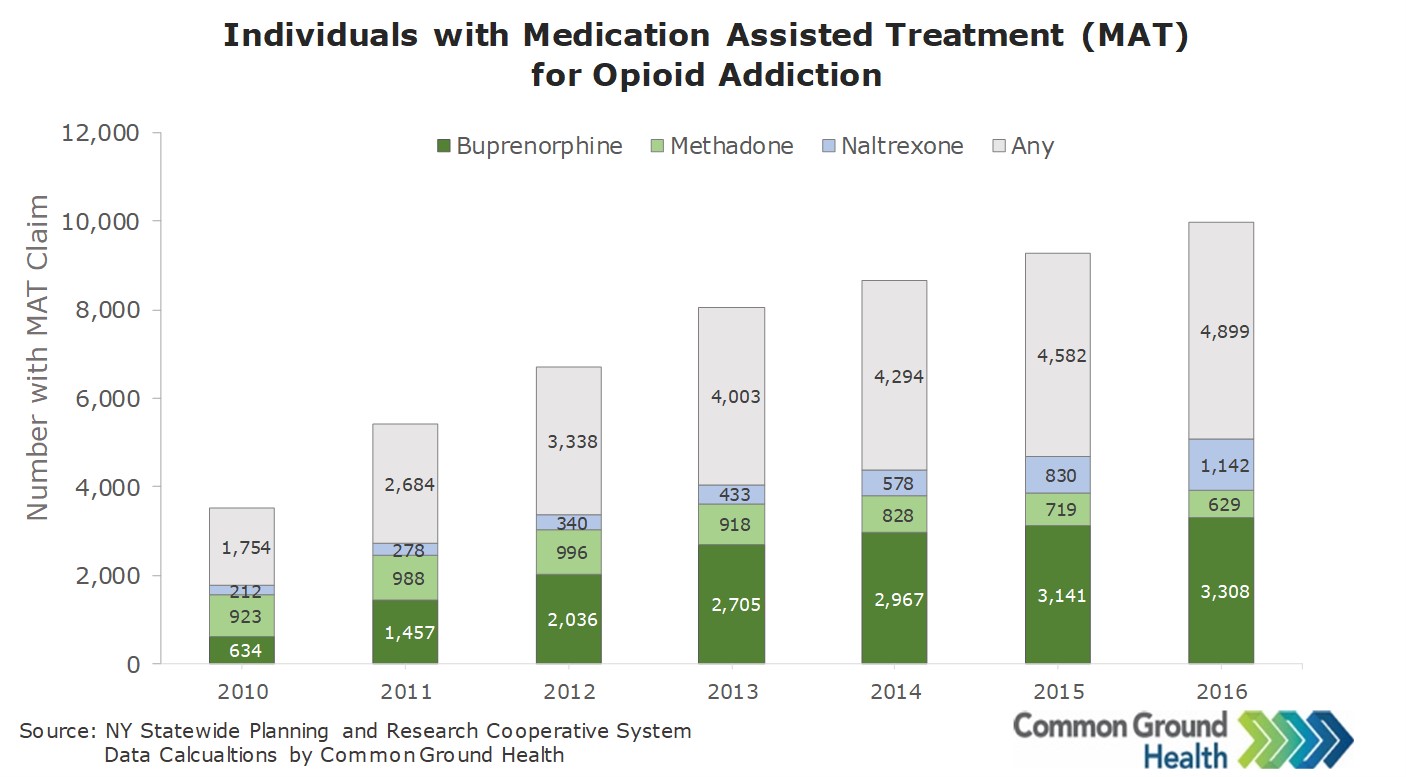
Individuals using Medication Assisted Treatment (MAT)
for Opioid Addiction
Buprenorphine
| 2010 | 634 |
| 2011 | 1457 |
| 2012 | 2036 |
| 2013 | 2705 |
| 2014 | 2967 |
| 2015 | 3141 |
| 2016 | 3308 |
Methadone
| 923 |
| 988 |
| 996 |
| 918 |
| 828 |
| 719 |
| 629 |
Naltrexone
| 212 |
| 278 |
| 340 |
| 433 |
| 578 |
| 830 |
| 1,142 |
Any
| 1754 |
| 2684 |
| 3338 |
| 4003 |
| 4294 |
| 4582 |
| 4899 |
Source: Common Ground Health Claims Database