• About
    • History
    • Mission
    • Board of Directors
    • Our Partners
  • Insights
    • Insights Library
    • Reports
    • Regional Health Measures
    • County Data
      • Chemung County
      • Livingston County
      • Monroe County
      • Ontario County
      • Schuyler County
      • Seneca County
      • Steuben County
      • Wayne County
      • Yates County
    • Health Indicators
  • Collaborations
    • African American Health Coalition
    • Central Southern Tier Health Alliance
    • Community Health & Well-being
    • Community Technology Assessment Advisory Board (CTAAB)
    • Empire State Trail Health Impact Assessment
    • Finger Lakes COVID-19 Vaccine Task Force
    • Finger Lakes Reopening Schools Safely Task Force
    • Healthi Kids Coalition
    • Indigenous Health Initiative
    • Latino Health Coalition
    • Older Adults and Long-Term Care
    • Regional Health Care Workforce Consortium
    • Regional Leadership
    • Past Initiatives
      • Food and Health Connection
      • Practice Transformation
  • News
    • Common Ground Newsletter
    • Work Force Newsletter
    • Meeting Minutes
  • Contact
    • Our Team
    • Careers
    • Speakers
Explore Topics

Search

Explore Topics

  • Access to Care
  • Behavioral Health
  • Cancer
  • Chronic Conditions
  • Dental Health
  • Health Behaviors
  • Population Demographics
  • Pregnancy / Infant Mortality
  • Premature Mortality
  • Social Determinants
  • Substance Abuse
  • All Insights

Search

Explore Topics

  • Access to Care
  • Behavioral Health
  • Cancer
  • Chronic Conditions
  • Dental Health
  • Health Behaviors
  • Population Demographics
  • Pregnancy / Infant Mortality
  • Premature Mortality
  • Social Determinants
  • Substance Abuse
  • All Insights
  1. Home
  2. Insights
  3. Library
  4. Behavioral Health-Related ED & Inpatient Visit Rate by Socioeconomic Status & Geography

Behavioral Health-Related ED & Inpatient Visit Rate by Socioeconomic Status & Geography

New York Finger Lakes Region

The following charts also highlight the strong relationship between socioeconomic status and the rates of inpatient and ED visits related to behavioral health. Within SES groups 1-3, the urban population has highest rates of both types of visits. The rural rates are generally comparable to the suburban rates.


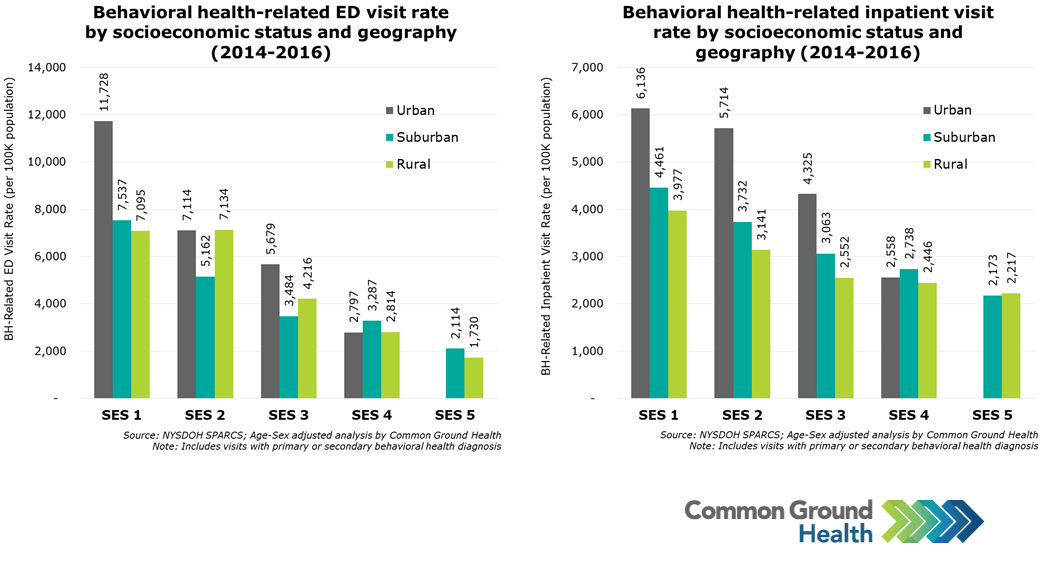
Methodology note: The SES index ranking was developed by Common Ground Health and calculated using a variety of socioeconomic indicators from the American Community Survey including average income, poverty rates, education levels, housing value, and homeownership. Each ZIP code is assigned a socioeconomic (SES) index ranking from 1 to 5. The lower SES ZIP codes tend to have lower average income, higher poverty rates, lower prevalence of college degrees, etc.

Behavioral Health-Related ED & Inpatient Visit Rate by Socioeconomic Status & Geography
Download Image

Images are available for download at no cost and free of any copyright restrictions. We ask that you keep the Common Ground logo on the images to identify the source. To help us improve, we’d love to hear how you are using these resources. Email us at communications@commongroundhealth.org.

Share Insight


Other charts you may be interested in:

Relationship between mental health and financial stress
Behavioral Health-Related ED & Inpatient Visit Rate by Socioeconomic Status & Race/Ethnicity
Anxiety/Depression/Stress: ED & Inpatient Visit Rate by Race/Ethnicity
585.224.3101 |
Common Ground Health

 1150 University Avenue Rochester NY 14607

Mailing Address: PO Box 160 | Mt. Morris, NY 14510

585.224.3101 | communications@commongroundhealth.org
Sign up for our newsletters Sign up for our newsletters

© Common Ground Health 2023 | All Rights Reserved | Privacy Policy | Sitemap

Contact Us