
Preventable (PQI) Inpatient Visit Rates by Race/Ethnicity and Place
New York Finger Lakes Region (2014 - 2016)
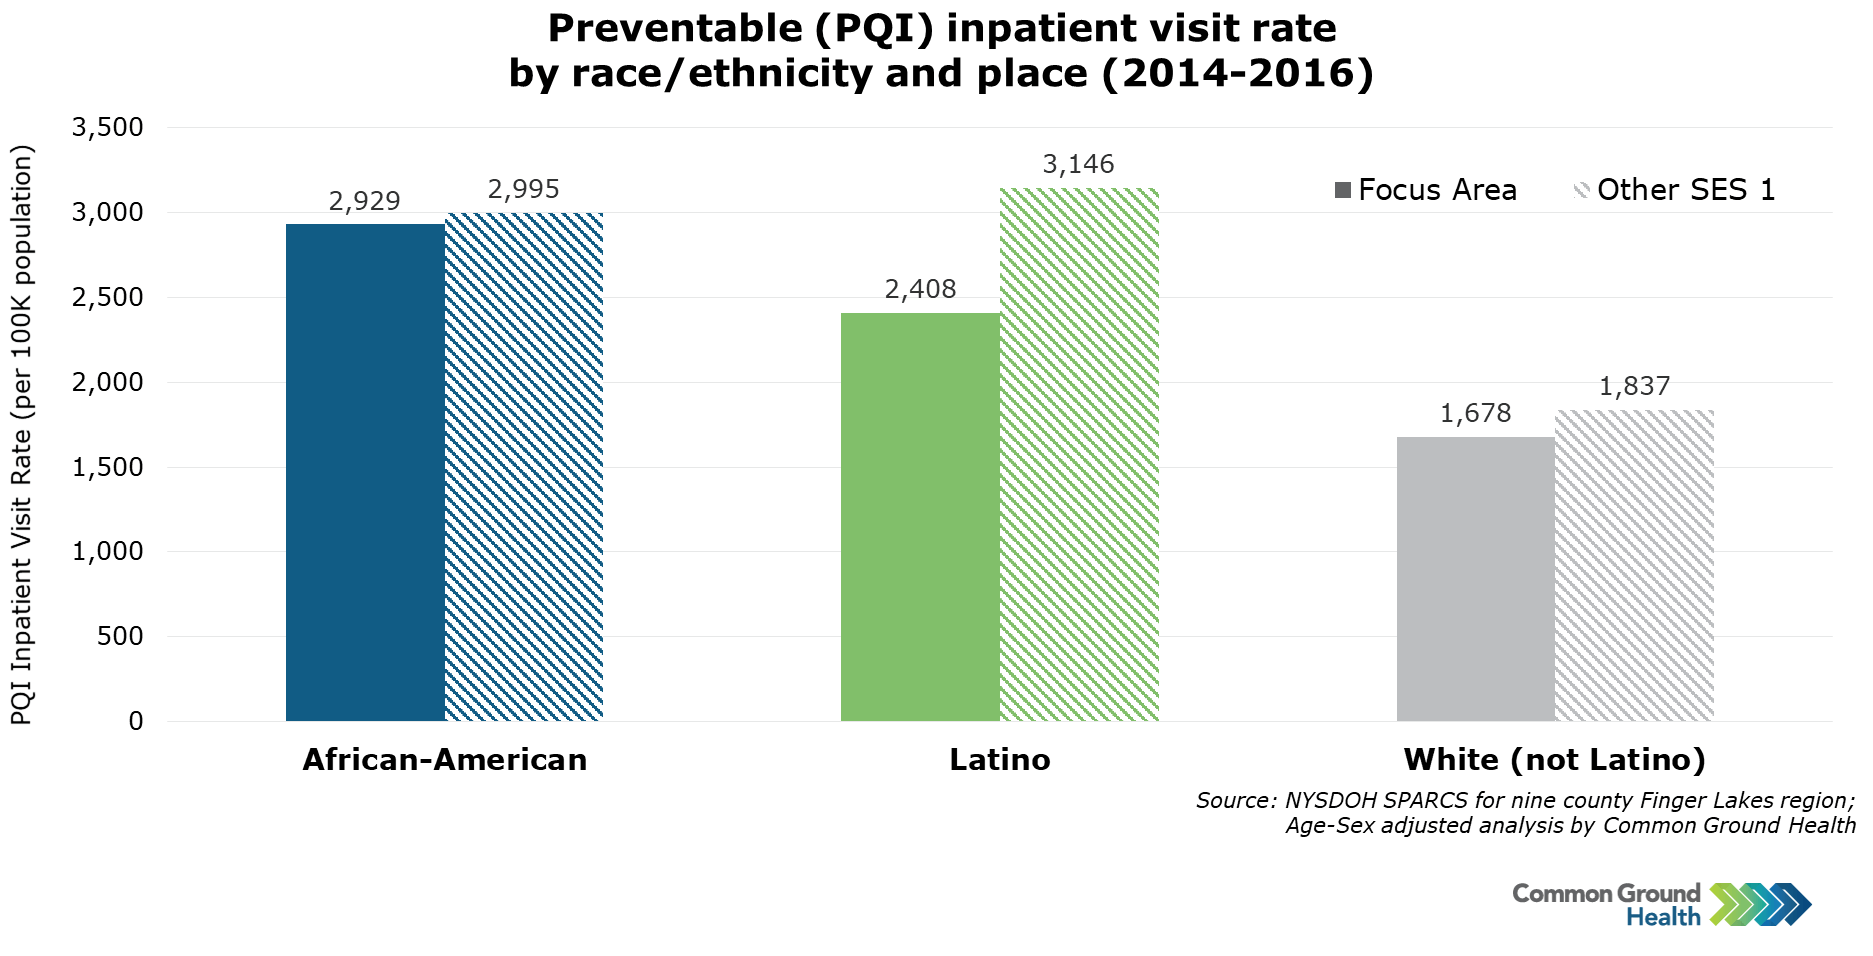
The chart below compares the preventable inpatient (PQI) visit rates for the Focus Area* vs. other SES 1 ZIP codes in the region. While many outcomes and metrics are worse in the Focus Area than socioeconomic and racial/ethnic differences would predict, that is not the case with the PQI rate. The PQI rates for whites and African-Americans are essentially the same in the Focus Area vs. other SES 1 ZIP codes, and the rate is actually lower for Latinos.
* The Focus Area consists of eight high-poverty ZIP codes in the city of Rochester with particularly high concentration of African-Americans and Latinos. See a map of the Focus Area here.
Methodology note: The SES index ranking was developed by Common Ground Health and calculated using a variety of socioeconomic indicators from the American Community Survey including average income, poverty rates, education levels, housing value, and homeownership. Each ZIP code is assigned a socioeconomic (SES) index ranking from 1 to 5. The lower SES ZIP codes tend to have lower average income, higher poverty rates, lower prevalence of college degrees, etc.
Images are available for download at no cost and free of any copyright restrictions. We ask that you keep the Common Ground logo on the images to identify the source. To help us improve, we’d love to hear how you are using these resources. Email us at communications@commongroundhealth.org.


