
Years of Potential Life Lost Due to Health Inequity
Finger Lakes Region
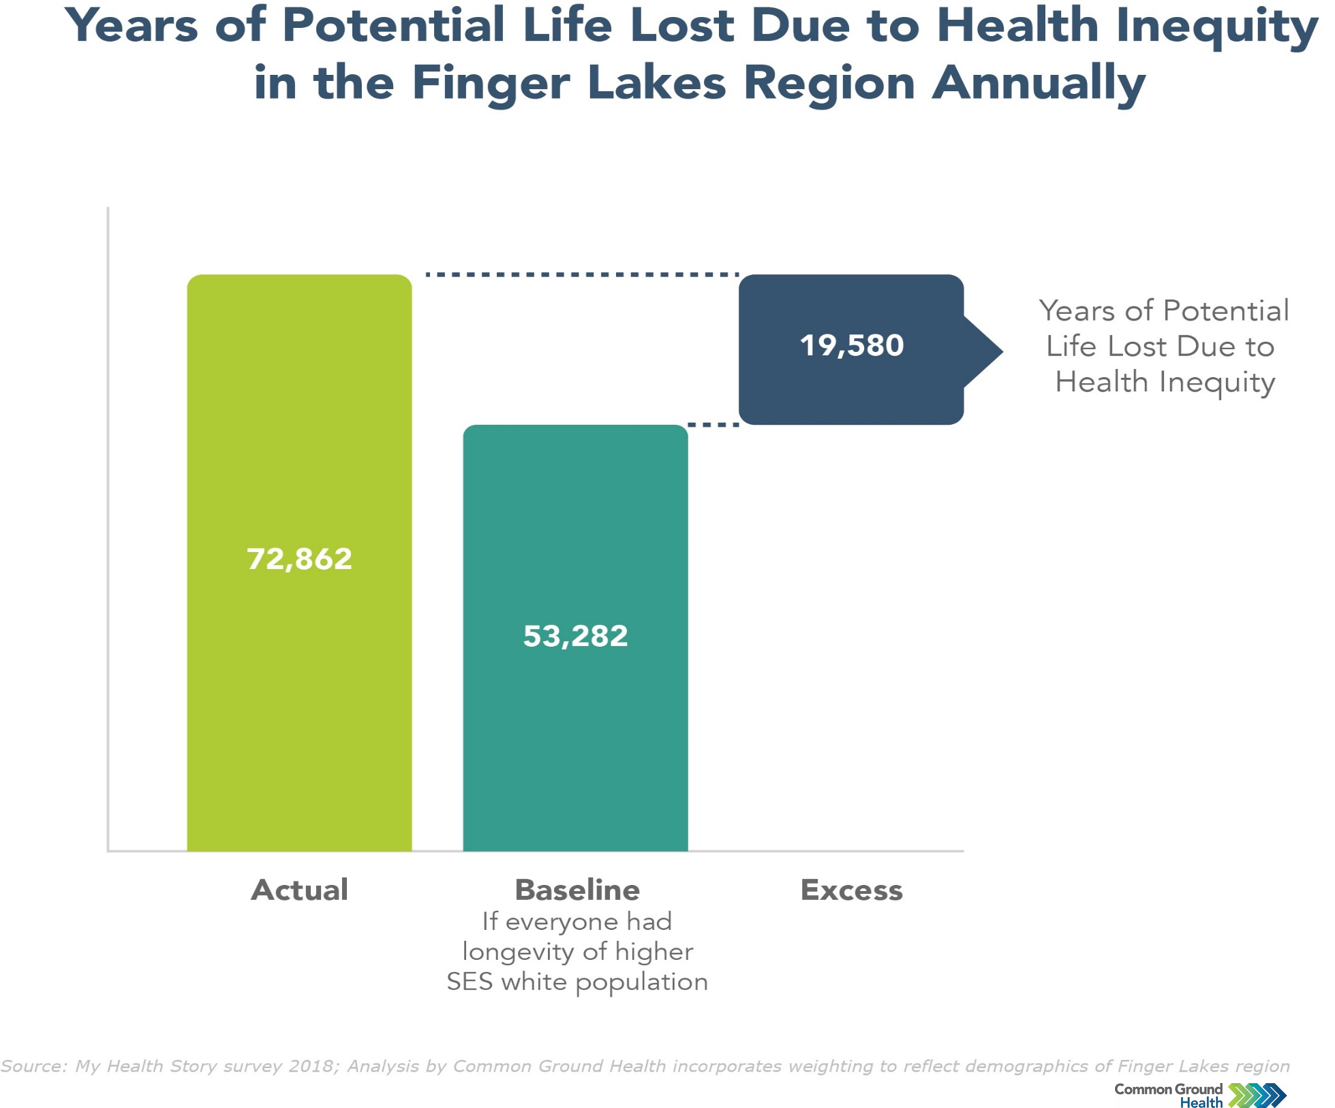
This chart shows one approach to measuring the impact of health inequity.
Years of potential life lost due to health inequity is calculated as the difference between the actual total years of potential life lost and a baseline representing the expected total if everyone had the same longevity as the benchmark population. For this analysis, the benchmark population is White non-Latinos living in ZIP codes with higher socioeconomic status.
The regional cost is nearly 20,000 years of life lost annually to health inequity. This is more than the total years of life lost to all forms of cancer combined. The largest driver of this excess premature mortality is socioeconomic inequality. Over 80% of these lost years of life are attributable to differences in socioeconomic status.
This data visualization is part of Overloaded: The Heavy Toll of Poverty on Our Region's Health Report.
Methodology note: The SES index ranking was developed by Common Ground Health and calculated using a variety of socioeconomic indicators from the American Community Survey including average income, poverty rates, education levels, housing value, and homeownership. Each ZIP code is assigned a socioeconomic (SES) index ranking from 1 to 5. The lower SES ZIP codes tend to have lower average income, higher poverty rates, lower prevalence of college degrees, etc.
Methodology note: Years of potential life lost (YPLL) is a widely used measure to assess the rate of premature mortality. YPLL places a larger weight on the deaths of younger people, in contrast with overall mortality statistics which are dominated by deaths of the elderly. The YPLL rates in Common Ground Health analyses are derived using 75 years as the baseline. A death at age 65 has YPLL of 10, where as a death at age 35 has a YPLL of 40. The rates are calculated per 100,000 population and are age-sex adjusted to account for differences in population distribution.
Images are available for download at no cost and free of any copyright restrictions. We ask that you keep the Common Ground logo on the images to identify the source. To help us improve, we’d love to hear how you are using these resources. Email us at communications@commongroundhealth.org.


