
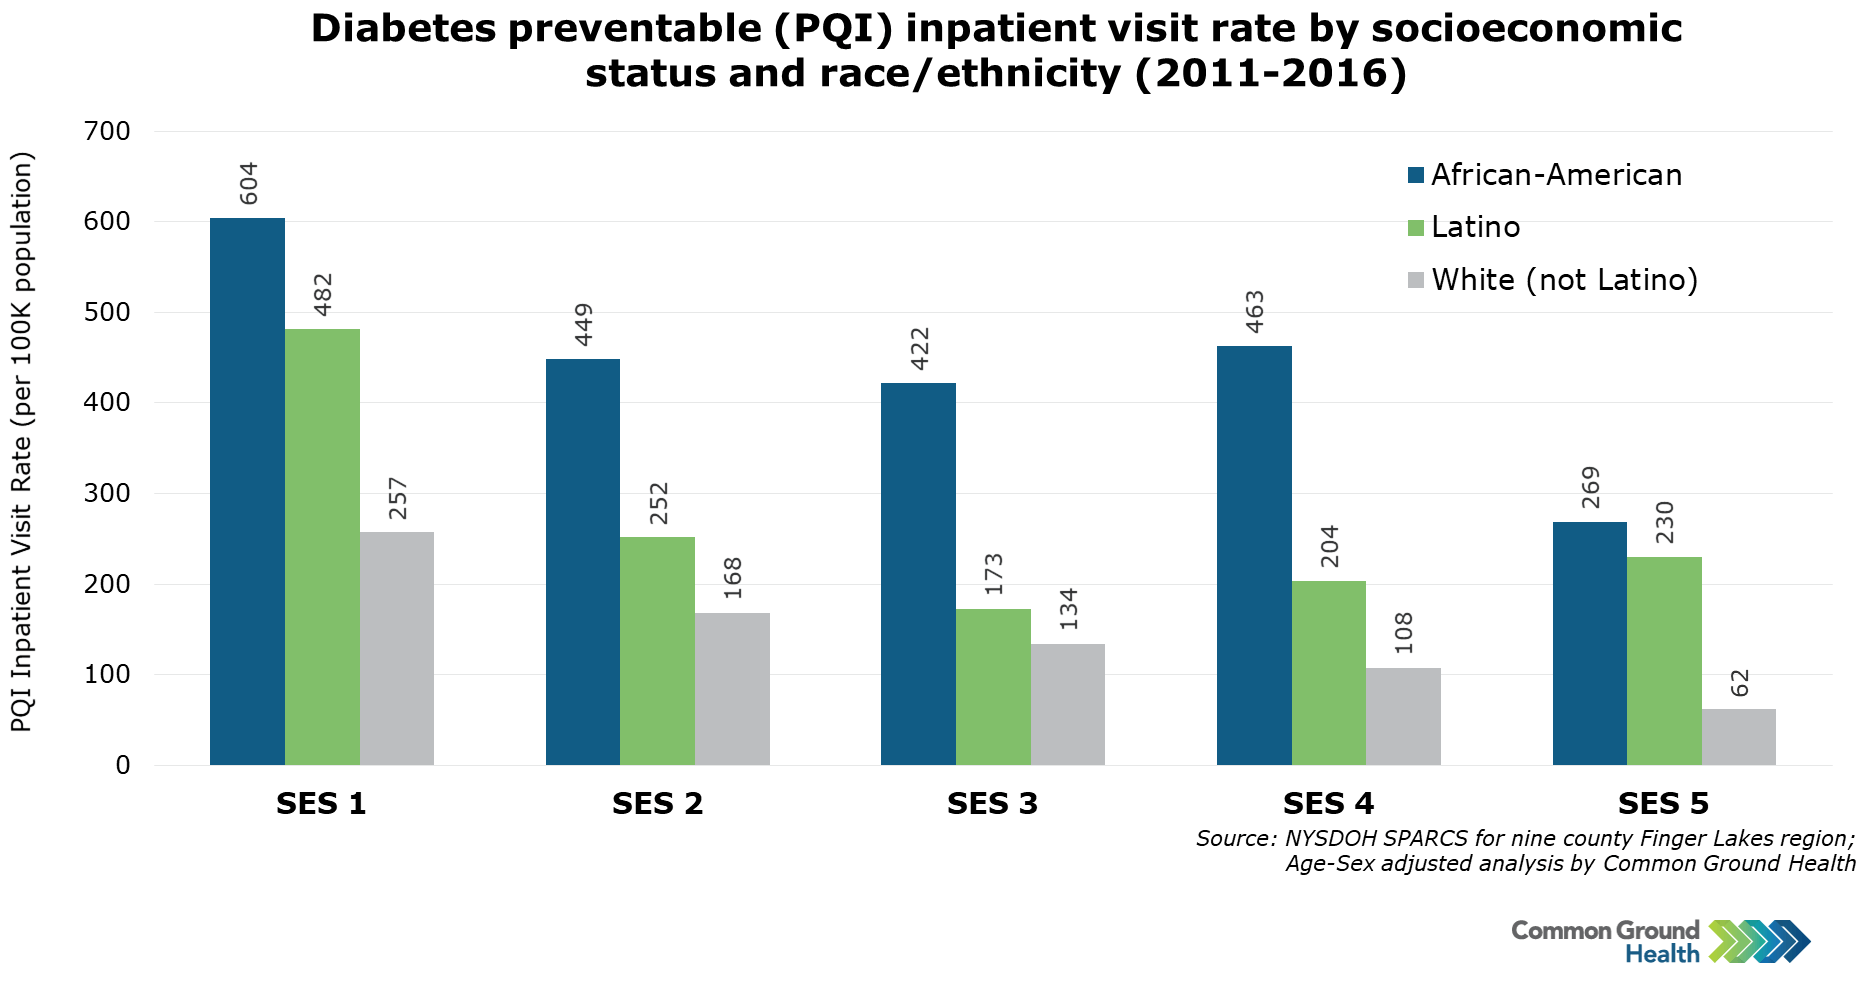
Diabetes Preventable (PQI) Inpatient Visit Rate by Socioeconomic Status & Race/Ethnicity
New York Finger Lakes Region (2011-2016)
The data below document a clear socioeconomic disparity. The diabetes PQI rates are lower for the higher SES groups. The chart also shows that the racial/ethnic disparity is above and beyond any socioeconomic effect. At each SES level, the PQI rates for the black and Latino populations is higher than the white rates. This is particular true for African-Americans – their highest SES population experiences a higher PQI rate than the lowest white SES group.
Methodology note: The SES index ranking was developed by Common Ground Health and calculated using a variety of socioeconomic indicators from the American Community Survey including average income, poverty rates, education levels, housing value, and homeownership. Each ZIP code is assigned a socioeconomic (SES) index ranking from 1 to 5. The lower SES ZIP codes tend to have lower average income, higher poverty rates, lower prevalence of college degrees, etc.
Images are available for download at no cost and free of any copyright restrictions. We ask that you keep the Common Ground logo on the images to identify the source. To help us improve, we’d love to hear how you are using these resources. Email us at communications@commongroundhealth.org.


